ChatGPT for a quick Leaflet project in class

People have been gushing over ChatGPT for some time now, especially my tech friends. I've wanted to try it for making some small projects. Today I had my chance.
During a methods class for my urban studies program, we learned to use Maptionnaire and did an informal survey of our classmates. Afterward, we had the chance to analyze the data however we wanted. Most people used Maptionnaire's great built-in heatmap tool but it didn't offer a good way for showing the size of numeric responses.
Our survey asked "Where did you cry in Brussels?" and "How many tears did you cry?" I wanted to make a map to show not just where people cried but also some indicator of how much they cried. So I decided to use my programming skills to try to do this quickly.
In about 45 minutes, I was able to ask ChatGPT a few questions, tweak the responses and have a working demo.
ChatGPT Conversation
Q: How can I map GeoJSON in a way so that the size of the icon changes based on the specific value?
A: Use a mapping library such as Leaflet.
Q: How can I use this GeoJSON and map it with the Leaflet?
A: Some starter HTML that worked to display the points on the map.
Q: How can I change the above so the radius of each marker is proportional to the response to the question of how many tears?
A: Some changes to the code.
Q: How can I make it so that when you hover over a marker it says how many tears were cried?
A: Some more changes.
The answers to the above were longer. I'm only demonstrating the spirit of the conversation.
Screenshot
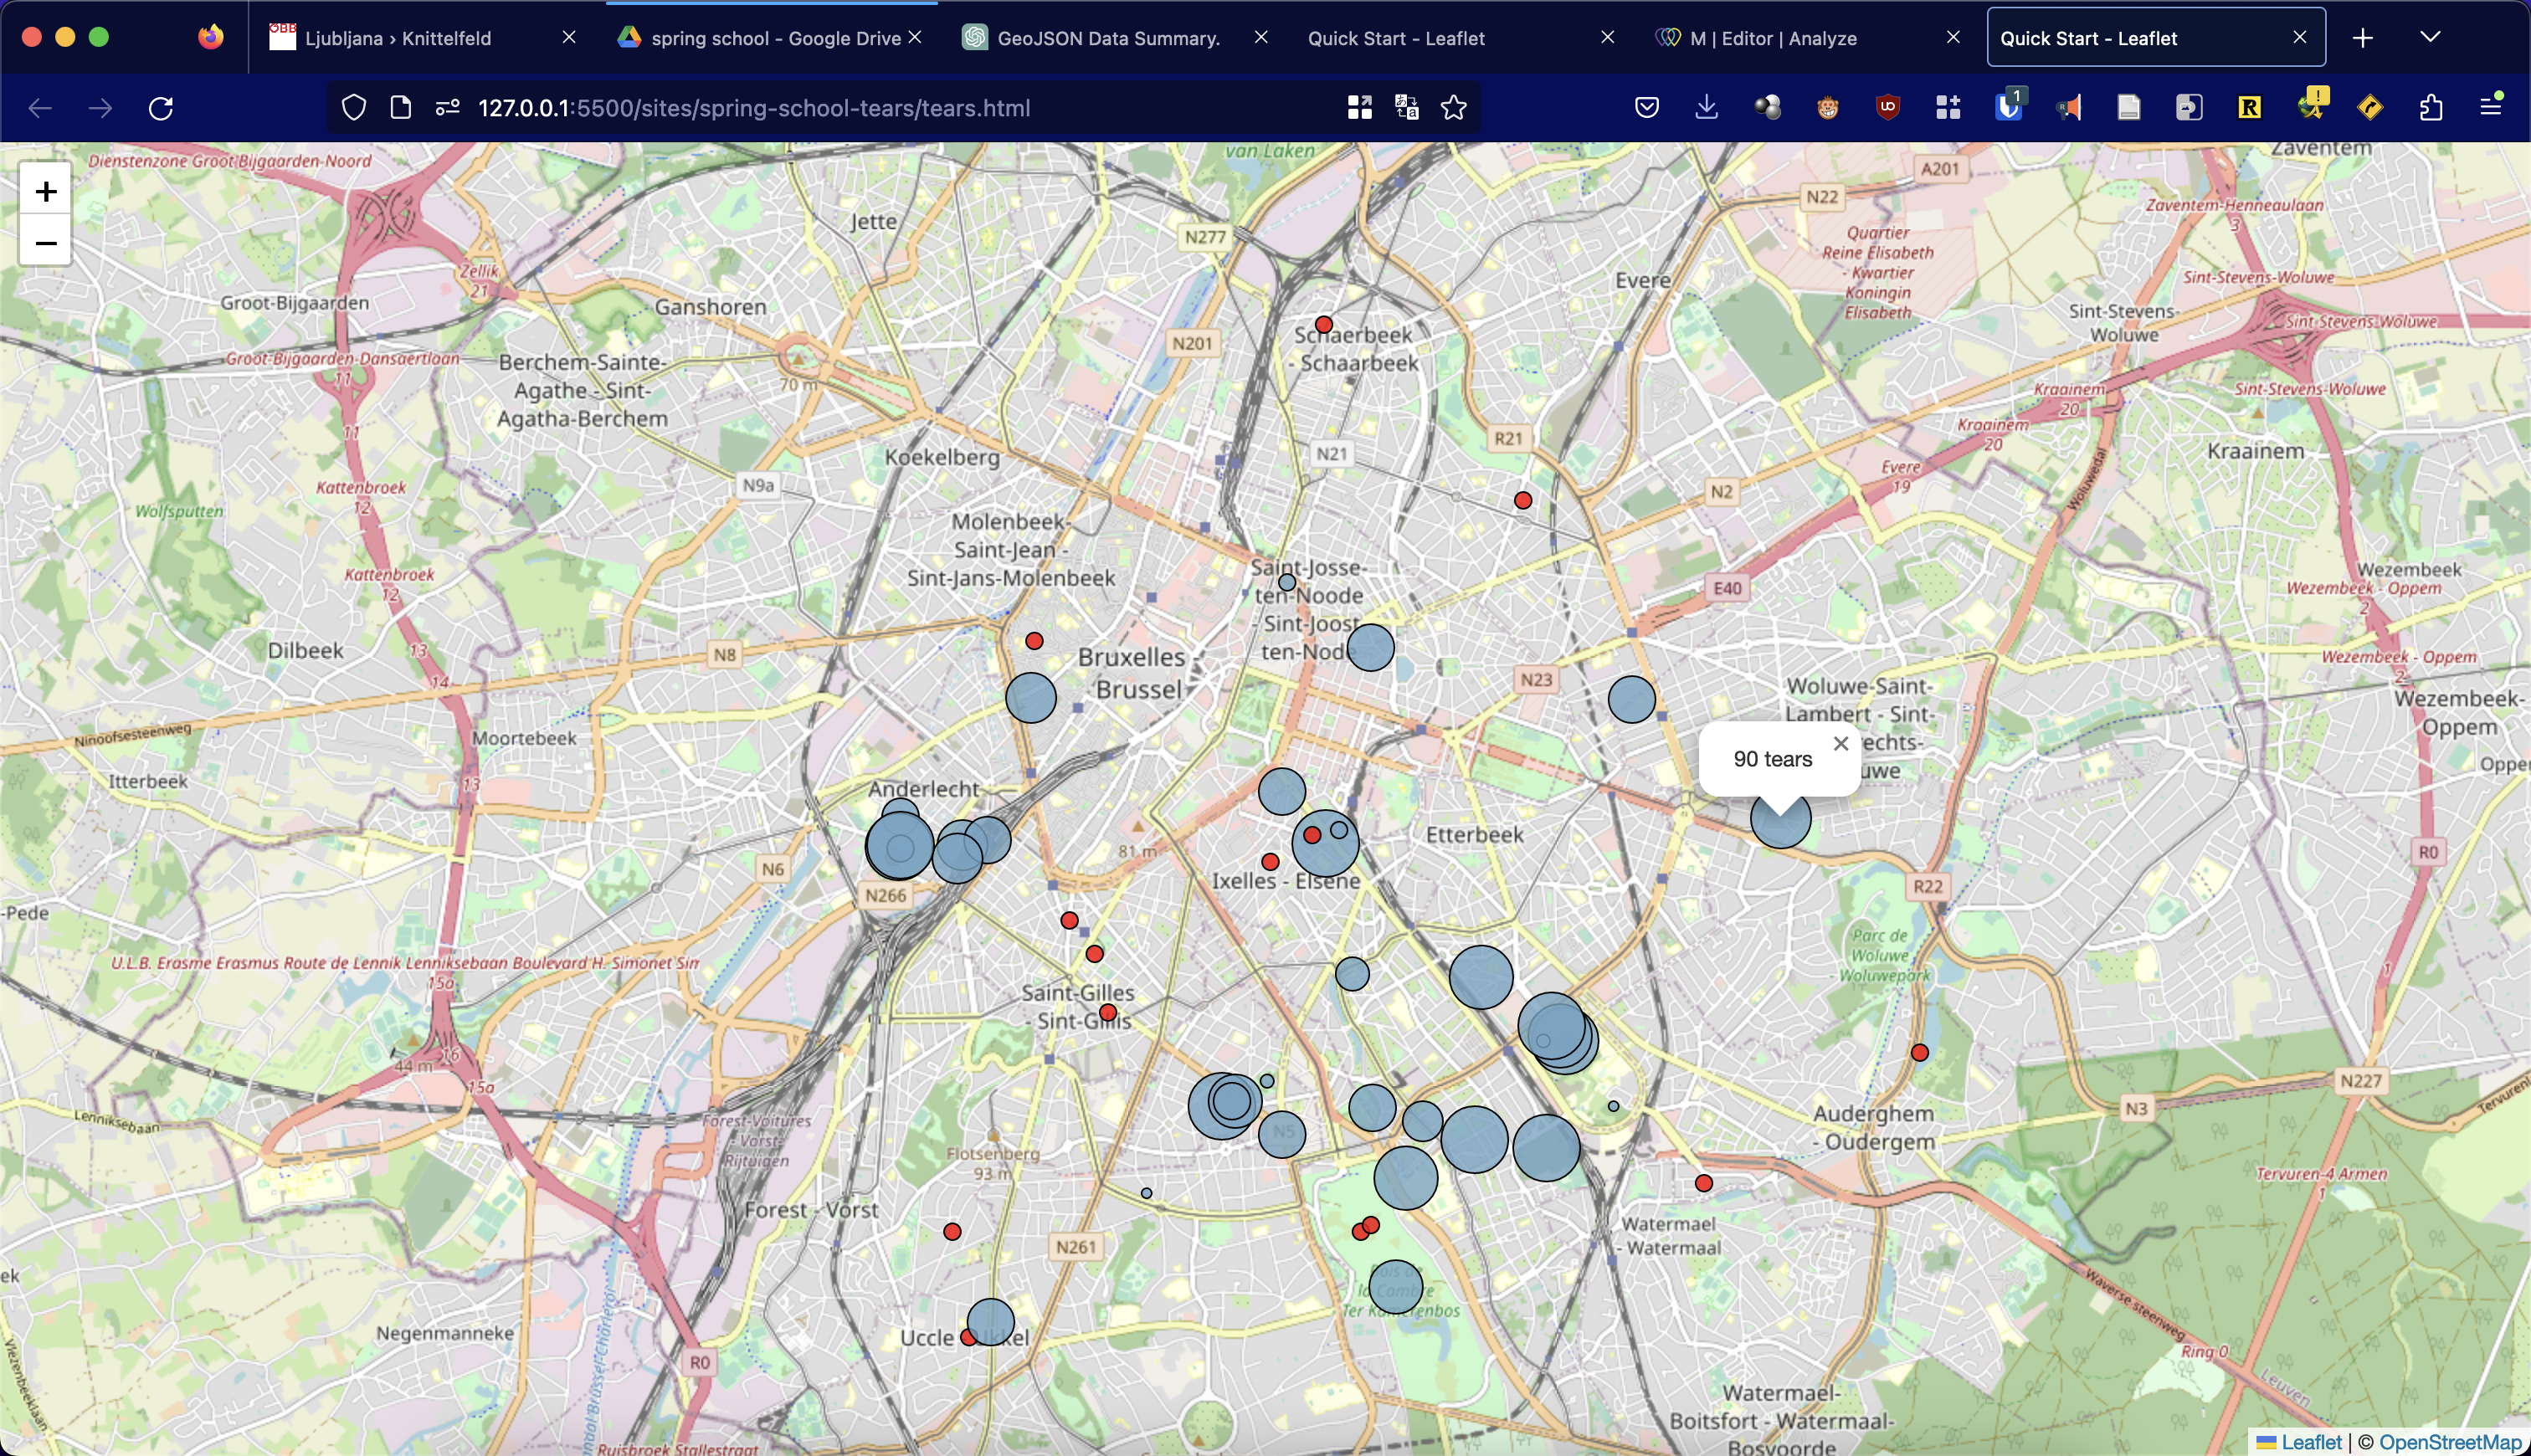
Live demo: https://www.rayberger.org/onepagers/sites/spring-school-tears/tears.html
Source: https://github.com/RayBB/onepagers/blob/main/sites/spring-school-tears/tears.html
Final Thoughts
Doing a project like this with ChatGPT can save a lot of time, especially when working with a new tool. However, the code it produced was a little weird and did require tweaking. For now, I doubt someone could do the same without some software development experience. However, it never hurts to give it a try and I'm sure the tech will be improving.
Comments
Join the discussionNo comments yet. Be the first to comment.